Don't Make Changes To Your Website Without Reading This! Google Analytics Behavior Reports.
WATCH
READ
It's different for every business, but at some point in time, whether weekly, monthly, quarterly or annually, your organization wants to make changes to the website.
Sometimes it's wanting to get strategic and improve for conversion optimization, such as moving around elements of various pages, changing button placements, updating web copy and imagery or designing and adding new pages.
Other times it's as simple as swapping out old copy for new, updated content, adding new employee bio pages, updating outdated contact information or just adding a new image to the homepage slider.
Then, of course, there's the million dollar question - "should we just redesign the whole thing?"
"I mean, let's just blow this thing up and start from scratch, right?"
Regardless of your business' or organization's goals or tasks, there's amazing news. There's a tool that can maximize your web design budget (assuming you know how to use it, of course).
It's a free tool, nested under Google Analytics, called Behavior Reports. In this video, I show you a practical exercise on how to use data in behavior reports to improve usability of your website, and what metrics to monitor to ensure/quantify said improvement.
Here is the general idea, at a basic level, using data to inform future web design / changes:
Step 1: Go to Google Analytics > Behavior > Top Content > Top Pages. Look for outliers with both high bounce rates and low bounce rates. High = Worst, highlighted in Red below. Low = Best, highlighted in Green below.
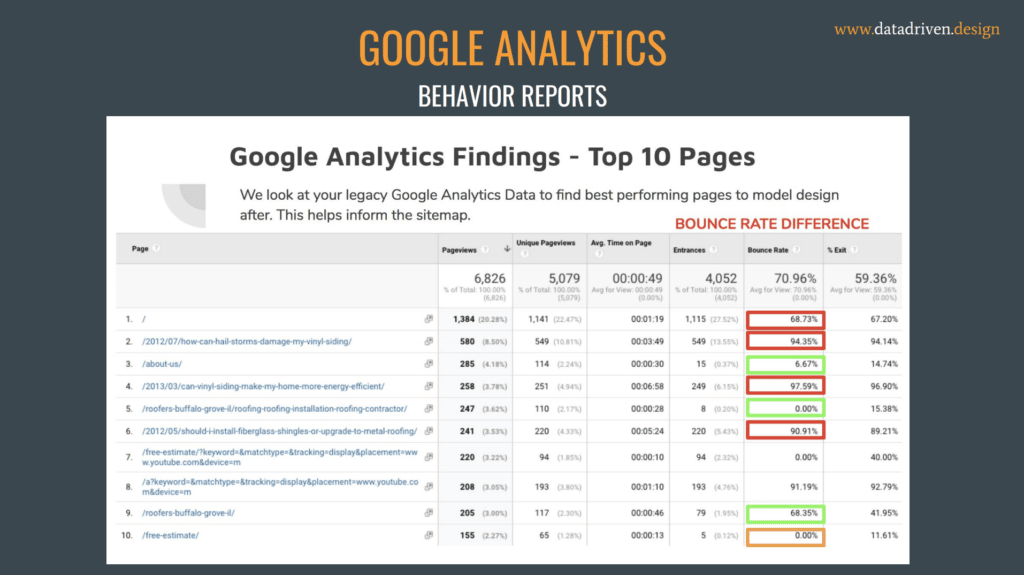
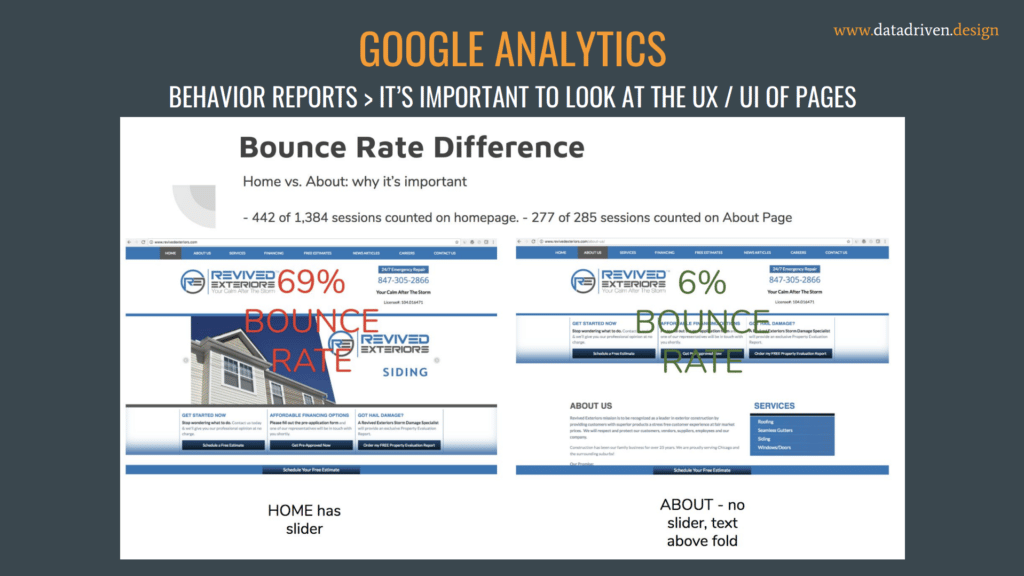
Step 2: Cross reference high bounce rate pages with low bounce rate pages. Ensure that you're doing this with enough pages to identify commonalities and consistencies between low performing pages (high bounce rates) and high performing pages (low bounce rates).
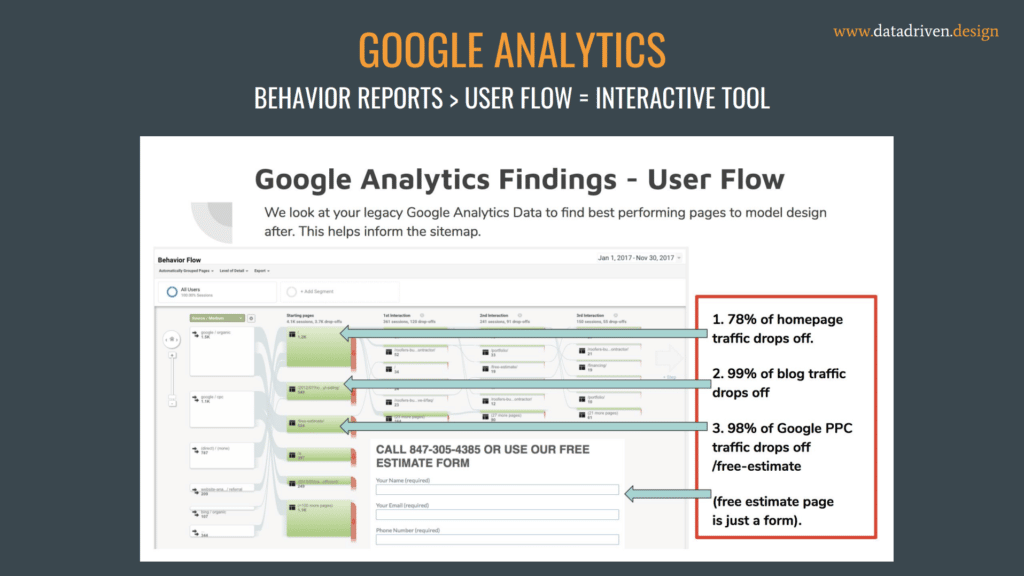
Step 3: Take a look at the User Flow/Behavior Flow. This will give you even more insights on how people navigate through the site. It gives important data around potential site structure changes, and sometimes even calls to action that need to be added to a page due to users falling off the site at a point where your business can't afford them to.
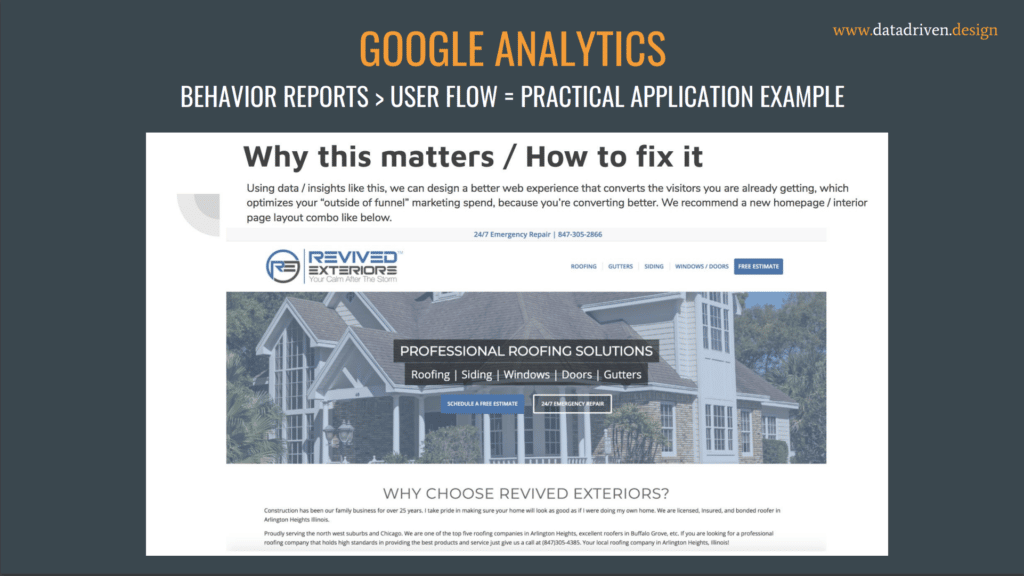
Step 4: Design pages that have all the commonalities of the top performing pages, married together with UX/UI best practices.
I realize this is a total crash course in Google Analytics Behavior Reports and how to use it. If you're really into this stuff and want to learn more, I highly encourage you to take our Data Driven Academy courses.
If you're not interested, and semi-confused by this blog post, just takeaway this one thing: don't like opinions drive your web design or web updates. There is data out there, that is free and easy to access, that should drive the process.
More content like this that I've published recently includes:
I've written about the importance of Google Analytics and how to get started setting it up on your website.
I've also written about understanding who your audience is by using Google Analytics Audience Reports.
How to get more web traffic using Google Analytics Acquisition Reports.
Feel free to email me at paul@datadriven.design with any questions.
Thanks and have a great day!
Paul Hickey has created and grown businesses via digital strategy and internet marketing for more than 10 years. His sweet spot is using analytics to design and build websites and grow the audience and revenue of businesses via SEO/Blogging, Google Adwords, Bing Ads, Facebook and Instagram Ads, Social Media Content Marketing and Email Marketing. The part that he’s most passionate about is quantifying next marketing actions based on real data.