ATTN Marketers: What Is Google Signals And Why Should You Care?
READ
If I called you, texted you or emailed you today and said "hey Rosa/Dawn/Phil/Victor/WhateverYourNameIs, you need to know about Google Signals - it's this thing in Google Analytics that adds an extra Acquisition Report."
You'd hang up / not reply or unsubscribe.
So what? Right?
But if I led that call with "yo, I've got data that can tell you how many of your customers come to your website from a mobile device, then come back and view it from a desktop device," you'd likely stop and listen.
If you're a smart marketer and businessperson that is.
From there, the conversation would lead into "once we analyze this data, we can tell you exactly where and how to market your products / services and build the proper marketing messaging flow to convert your impressions into sales."
Then you'd be in.
Because you'd realize that regardless of the type of business you own or run marketing for, that mobile visitor who comes back and makes a purchase or fills out a lead generation form on your website is critical for business growth.
Just like I've worked to show marketers and small business owners how 30-minutes per month in Google Analytics can help them grow their businesses and revenue, including:
- How to use Google Analytics to make Data Driven Web Design and Marketing Decisions
- How to track Users Likely To Buy From You
- Why you need to know about Top Conversion Paths (it takes 3-5 visits minimum before users are likely to buy from you)
- Creating a quality web user
- How to set up Goals in Google Analytics
-
Google Analytics gives you all you need to know about:
- Your website visitors (where they come from, what they’re interested in, how they view your website)
- What products and services you offer that your web users are most interested in
- How your audience currently finds you
- What pages / elements of your website are most effective/ineffective
- The effectiveness of marketing efforts (both online and offline)
- Making data driven marketing decisions by setting up a mini-business intelligence dashboard
...I'm going to continue to point out new features being consistently added to Google Analytics, and point out the business value behind adding them and understanding them.
Enter Cross Device Reports and Google Signals.
According to Google, Cross Device reporting in Analytics takes into account people who visit your website multiple times from different devices. Now, instead of seeing metrics in Analytics that show two separate sessions (e.g., one on desktop and the other on mobile), you’ll be able to see when users visited your website from two different devices. By understanding these device interactions as part of a broader customer experience, you can make more informed product and marketing decisions.
Say you’re a marketer for a travel company. With the new Acquisition Device report, you may find that a lot of your customers first come to your website on mobile to do their initial research before booking a trip later on desktop. Based on that insight, you might choose to prioritize mobile ad campaigns to reach people as they start to plan their trip.
In addition to the Acquisition Device report, you’ll soon have access to other Cross Device reports like Device Overlap, Device Paths and Channels. Our Cross Device reports only display aggregated and anonymized data from people who have opted in to personalized advertising (as always users can opt out at any time).
Reaching the right customers along the way
Analytics will also now help you create smarter audiences based on the actions people take on various devices. That way you can deliver more relevant and useful experiences.
Let’s say you’re a shoe retailer and you want to share a special promotion with your most loyal customers. You decide this means people who have purchased more than $500 in shoes on your website in the last 12 months using any of their devices. If a group of customers buy $300 worth of shoes on their phone and another $300 on their desktop, they’re just as valuable as another group who spend $600 on a single device, right?
Analytics now understands that these two groups of customers actually spent the same amount on your website, helping you create a more accurate audience list to reach the right customers. And spend isn’t the only way to segment and build audiences. You can also create remarketing campaigns to reach audiences based on how many times they visit your website across multiple devices.
How To Find Cross Device Reports In Google Analytics
Now that you know how Cross Device Reports can help you make data driven marketing decisions, here's how to find them in Google Analytics:
Log into analytics.google.com > Go to Audience Reports > Cross Device ...

If there's NO DATA there, here's why. You need to enable Google Signals.
Here's how to Enable Google Signals.
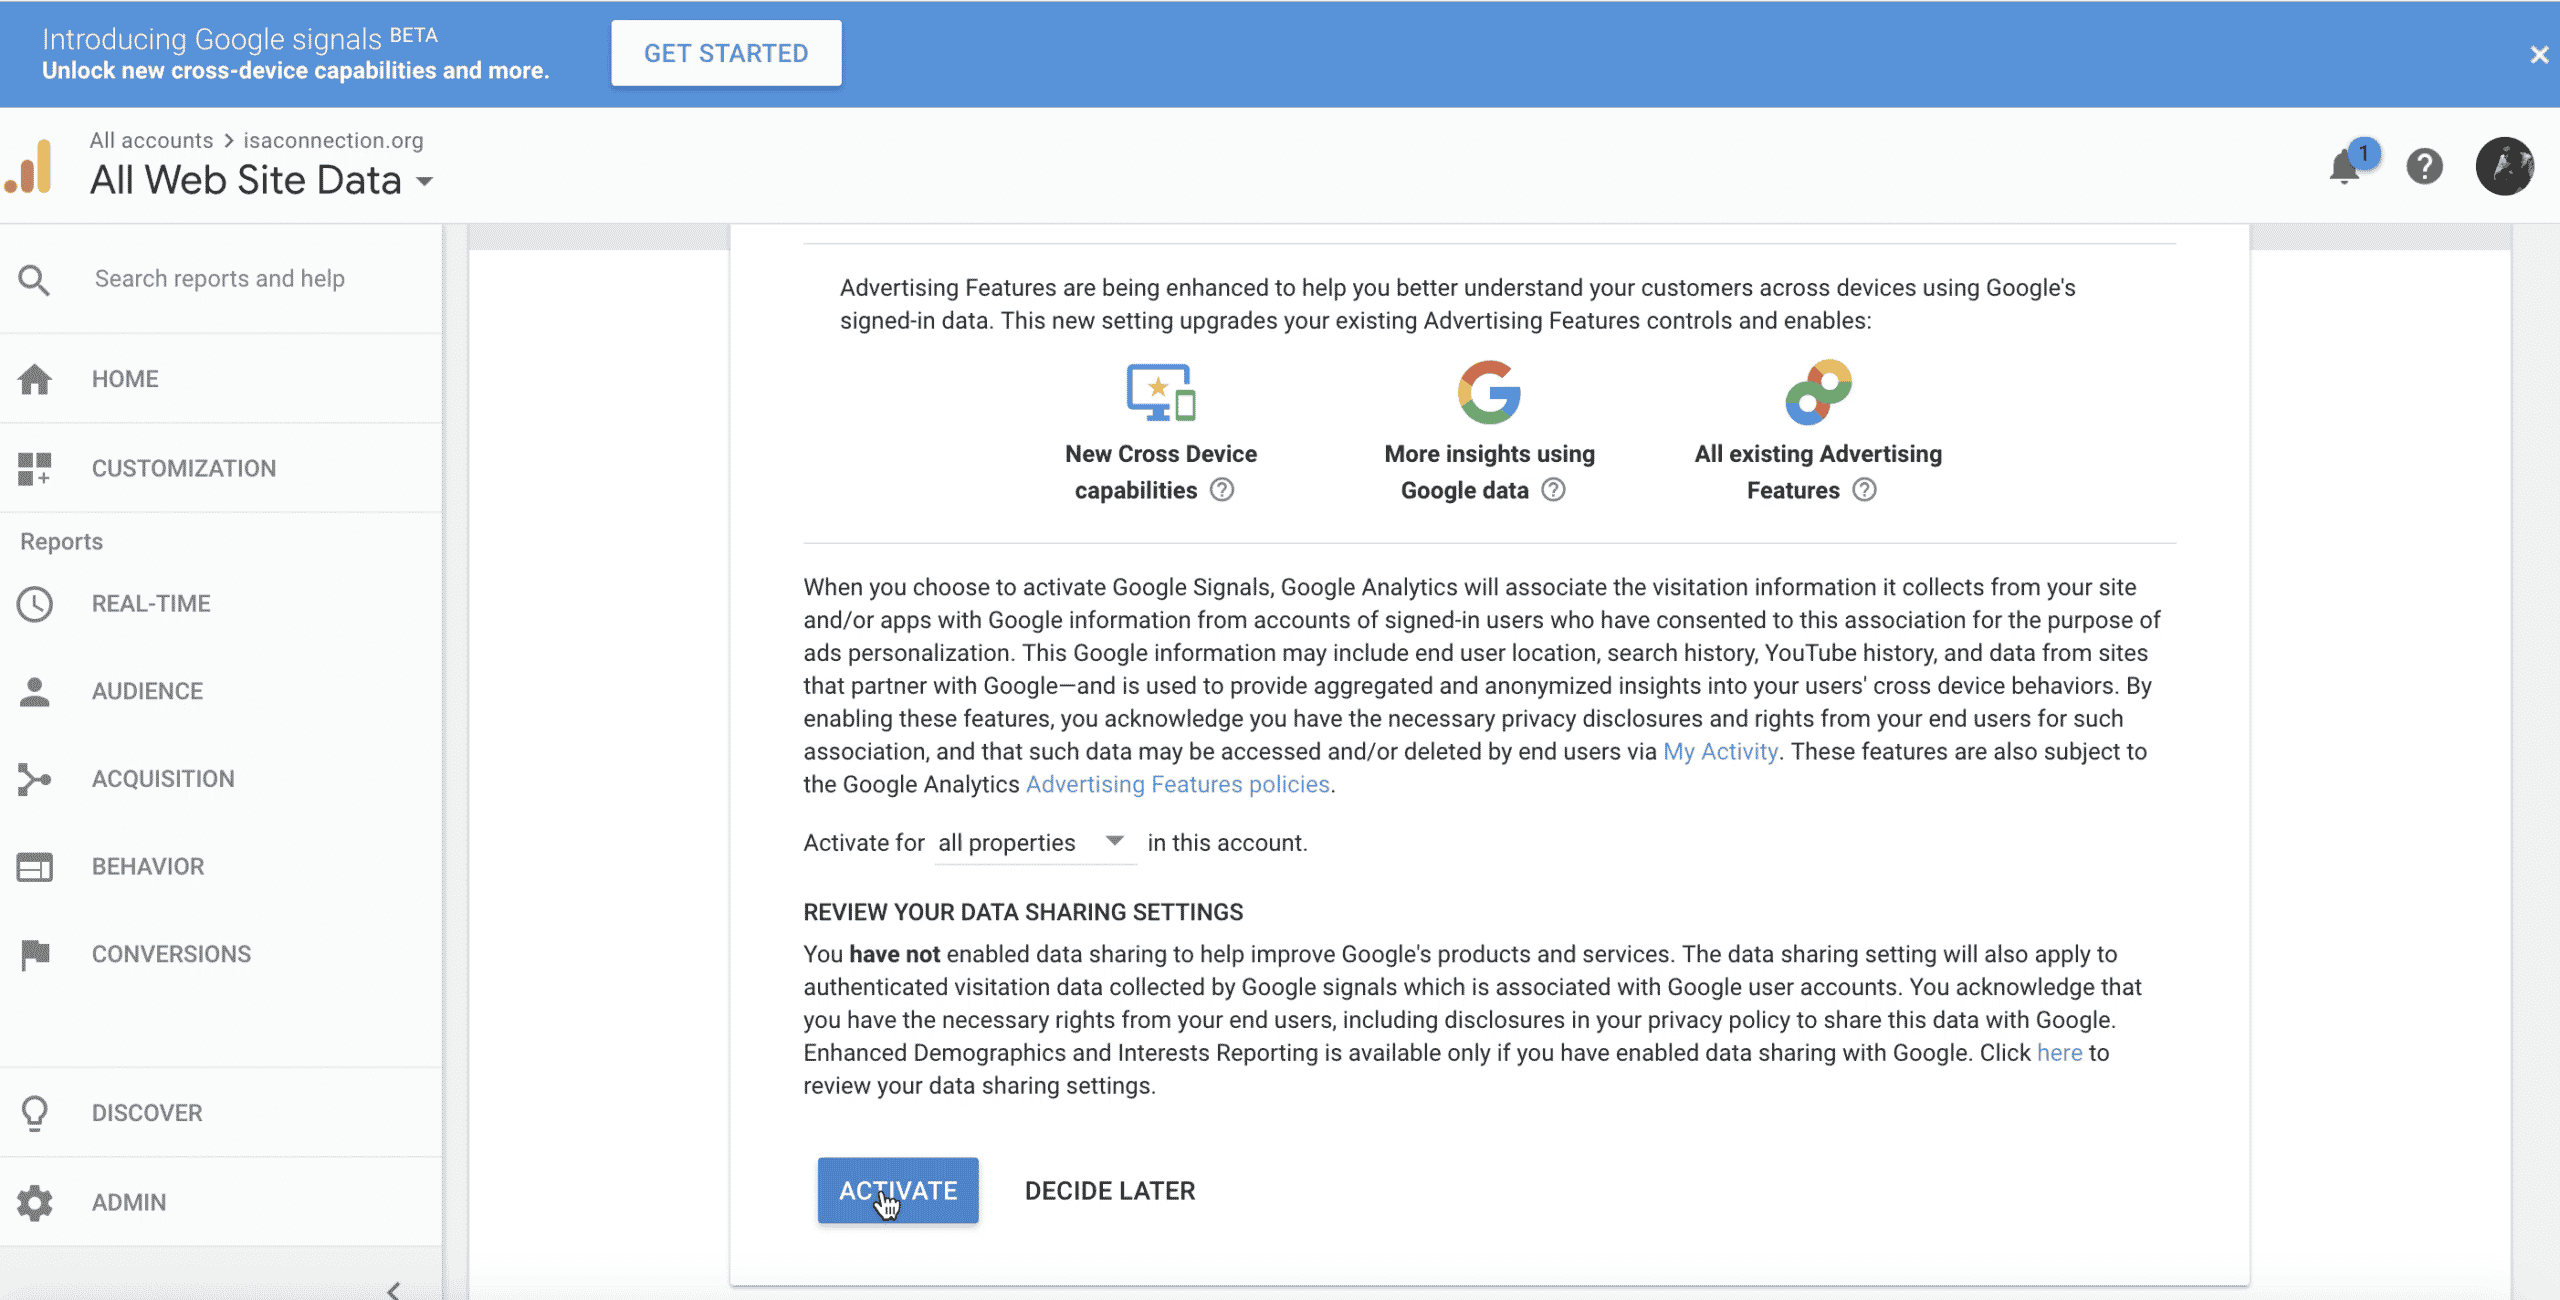
1. Some of you may see a call to action at the top of your Google Analytics dashboard after logging in. It would look like this...

if you see it. Click the "Get Started" Button, and follow through to activate it...

If you don't see this call to action, which most of you likely won't, then here's how to activate it.
Log into analytics.google.com > go to Admin > Property > Tracking Info > Data Collection > Turn On Data Collection for Google Signals.


So if I would have just titled this blog post - "How To Activate Google Signals," it might have been semi-interesting to a few data geeks.
However, knowing that marketers need this information to make business decisions, my hope is that I've opened it up to a handful more who will benefit from it.
Hit me up with any questions anytime at paul@datadriven.design.
Thanks for reading, watching and listening, and have a great day!
KEEP MARKETING!
Paul Hickey, Founder / CEO / Lead Strategist at Data Driven Design, LLC has created and grown businesses via digital strategy and internet marketing for more than 10 years. His sweet spot is using analytics to design and build websites and grow the audience and revenue of businesses via SEO/Blogging, Google Adwords, Bing Ads, Facebook and Instagram Ads, Social Media Content Marketing and Email Marketing. The part that he’s most passionate about is quantifying next marketing actions based on real data.